Debezium is a Database Change-Data-Capture (aka CDC) tool that is able to decode open source and proprietary database logs, normalize them to a standard payload format and push them into a series of Kafka topics. It implements the Confluent Kafka Connect interface so is built to be highly-available, has development supported by RedHat and commercial support from Confluent. If you are even moderately interested in data and the reason for Change-Data-Capture is not obvious head immediately to watch this.
Whilst its primary function is to replicate change events in near-realtime from relational and NoSQL databases to Kafka its secondary (and underappreciated) superpower is actually its ability to normalize events from a variety of databases into a standardized schema making consumption relatively easy from disparate databases. This means change events from Postgres, MySQL and even Mongo can be consumed without hundreds of lines of code to deal with their differences.
The biggest problem with Debezium that I have encountered comes from Database Administrators who raise the logical question: will this impact the performance of the database?
Conclusion
I was not able to measure significant CPU Utilisation impact on a MySQL database under load with Debezium enabled vs with Debezium disabled.
Hypothesis
Given that Debezium reuses the database logs (e.g. the binlog for MySQL or write-ahead-log for Postgres) which are already a key component of any online transaction processing (OLTP) database there should be minimal performance impact by enabling Debezium.
Additionally, from desktop research, there seems to be very little discussion on Github/forums regarding any performance impact indicating this is not a problem.
Experiment
The experiment was created to measure the CPU utilisation whilst running with limited online-transaction-processing (OTLP) read/write load (i.e. not an idle database) with and without Debezium running.
Setup
Database: MySQL 5.7 running on Google Cloud SQL on db-n1-standard-4 instance (4 vCPUs, 15 GB Memory, 100 GB SSD).
Load Generator: CH-benCHmark implemented via go-tpc at commit 17c89488c675bd1b931d0a3a4324302ea27cf6cd build using the Dockerfile in that repository. Environment ‘prepared’ with default configuration:
tpcc prepare --no-check
ch prepare --dropdata
ch --warehouses 1 --threads 4 --acThreads 2 --time 1800s run
This configuration produces a 30 minute execution with 4 OLTP threads (creating inserts, updates, deletes) and 2 ‘Analytical Client’ threads which run periodic heavy-read queries. These settings combined create approximately 3000 queries per second and create roughly 65% sustained CPU load on the database server (testing on an idle database would not be representative). This workload was chosen as it ensures both reads and writes are happening, the CPU is being worked and that there is CPU headroom available. Good work PingCAP for making this tool available!
Debezium: Official debezium/connect:1.4 (digest 558bd72c8783fe8ca0e2f8f3a7214f33371346e48f950936595dc3fb7079ef84) image from Docker Hub with the following configuration:
{
  "name": "tpcc",
  "config": {
    "acks": "all",
    "bigint.unsigned.handling.mode": "long",
    "connector.class": "io.debezium.connector.mysql.MySqlConnector",
    "database.history.kafka.bootstrap.servers": "kafka:9092",
    "database.history.kafka.topic": "tpcc.schema-history",
    "database.hostname": "${HOSTNAME}",
    "database.include.list": "tpcc",
    "table.include.list": "tpcc.orders",
    "database.password": "${PASSWORD}",
    "database.port": "3306",
    "database.server.id": "1",
    "database.server.name": "tpcc",
    "database.user": "root",
    "decimal.handling.mode": "string",
    "enable.time.adjuster": true,
    "errors.log.enable": true,
    "errors.log.include.messages": false,
    "include.query": false,
    "include.schema.changes": true,
    "key.converter.schemas.enable": false,
    "snapshot.mode": "initial",
    "tasks.max": "1",
    "topic.creation.default.replication.factor": "1",
    "topic.creation.default.partitions": "1",
    "topic.creation.default.cleanup.policy": "delete",
    "topic.creation.default.compression.type": "lz4",
    "value.converter.schemas.enable": false
  }
}
Kafka: Official confluentinc/cp-kafka:5.5.3 (digest ffbbcb233a76d648928d7f6c4f4784a9de925237c04fcb7fa18456ab7d3549a2) image from Docker Hub with no SSL and running locally with Docker. Testing performance of Kafka was out of scope of this exercise as it should not impact the CPU usage of the source MySQL database.
Measurement: The measurements were recorded by https://cloud.google.com/monitoring/ metrics which are automatically enabled for all Cloud SQL instances and records Average CPU Utilisation by 1 minute window.
Findings
This chart shows the CPU utilisation under two discrete scenarios.
- Baseline represents the MySQL Average CPU Utilisation per Minute when running the CH-benCHmark workload with the settings above for 30 minutes. 5 runs were recorded.
- Debezium represents the same workload as Baseline but with the Debezium connector also reading the logs and writing the events to Kafka in parallel. 5 runs were recorded.
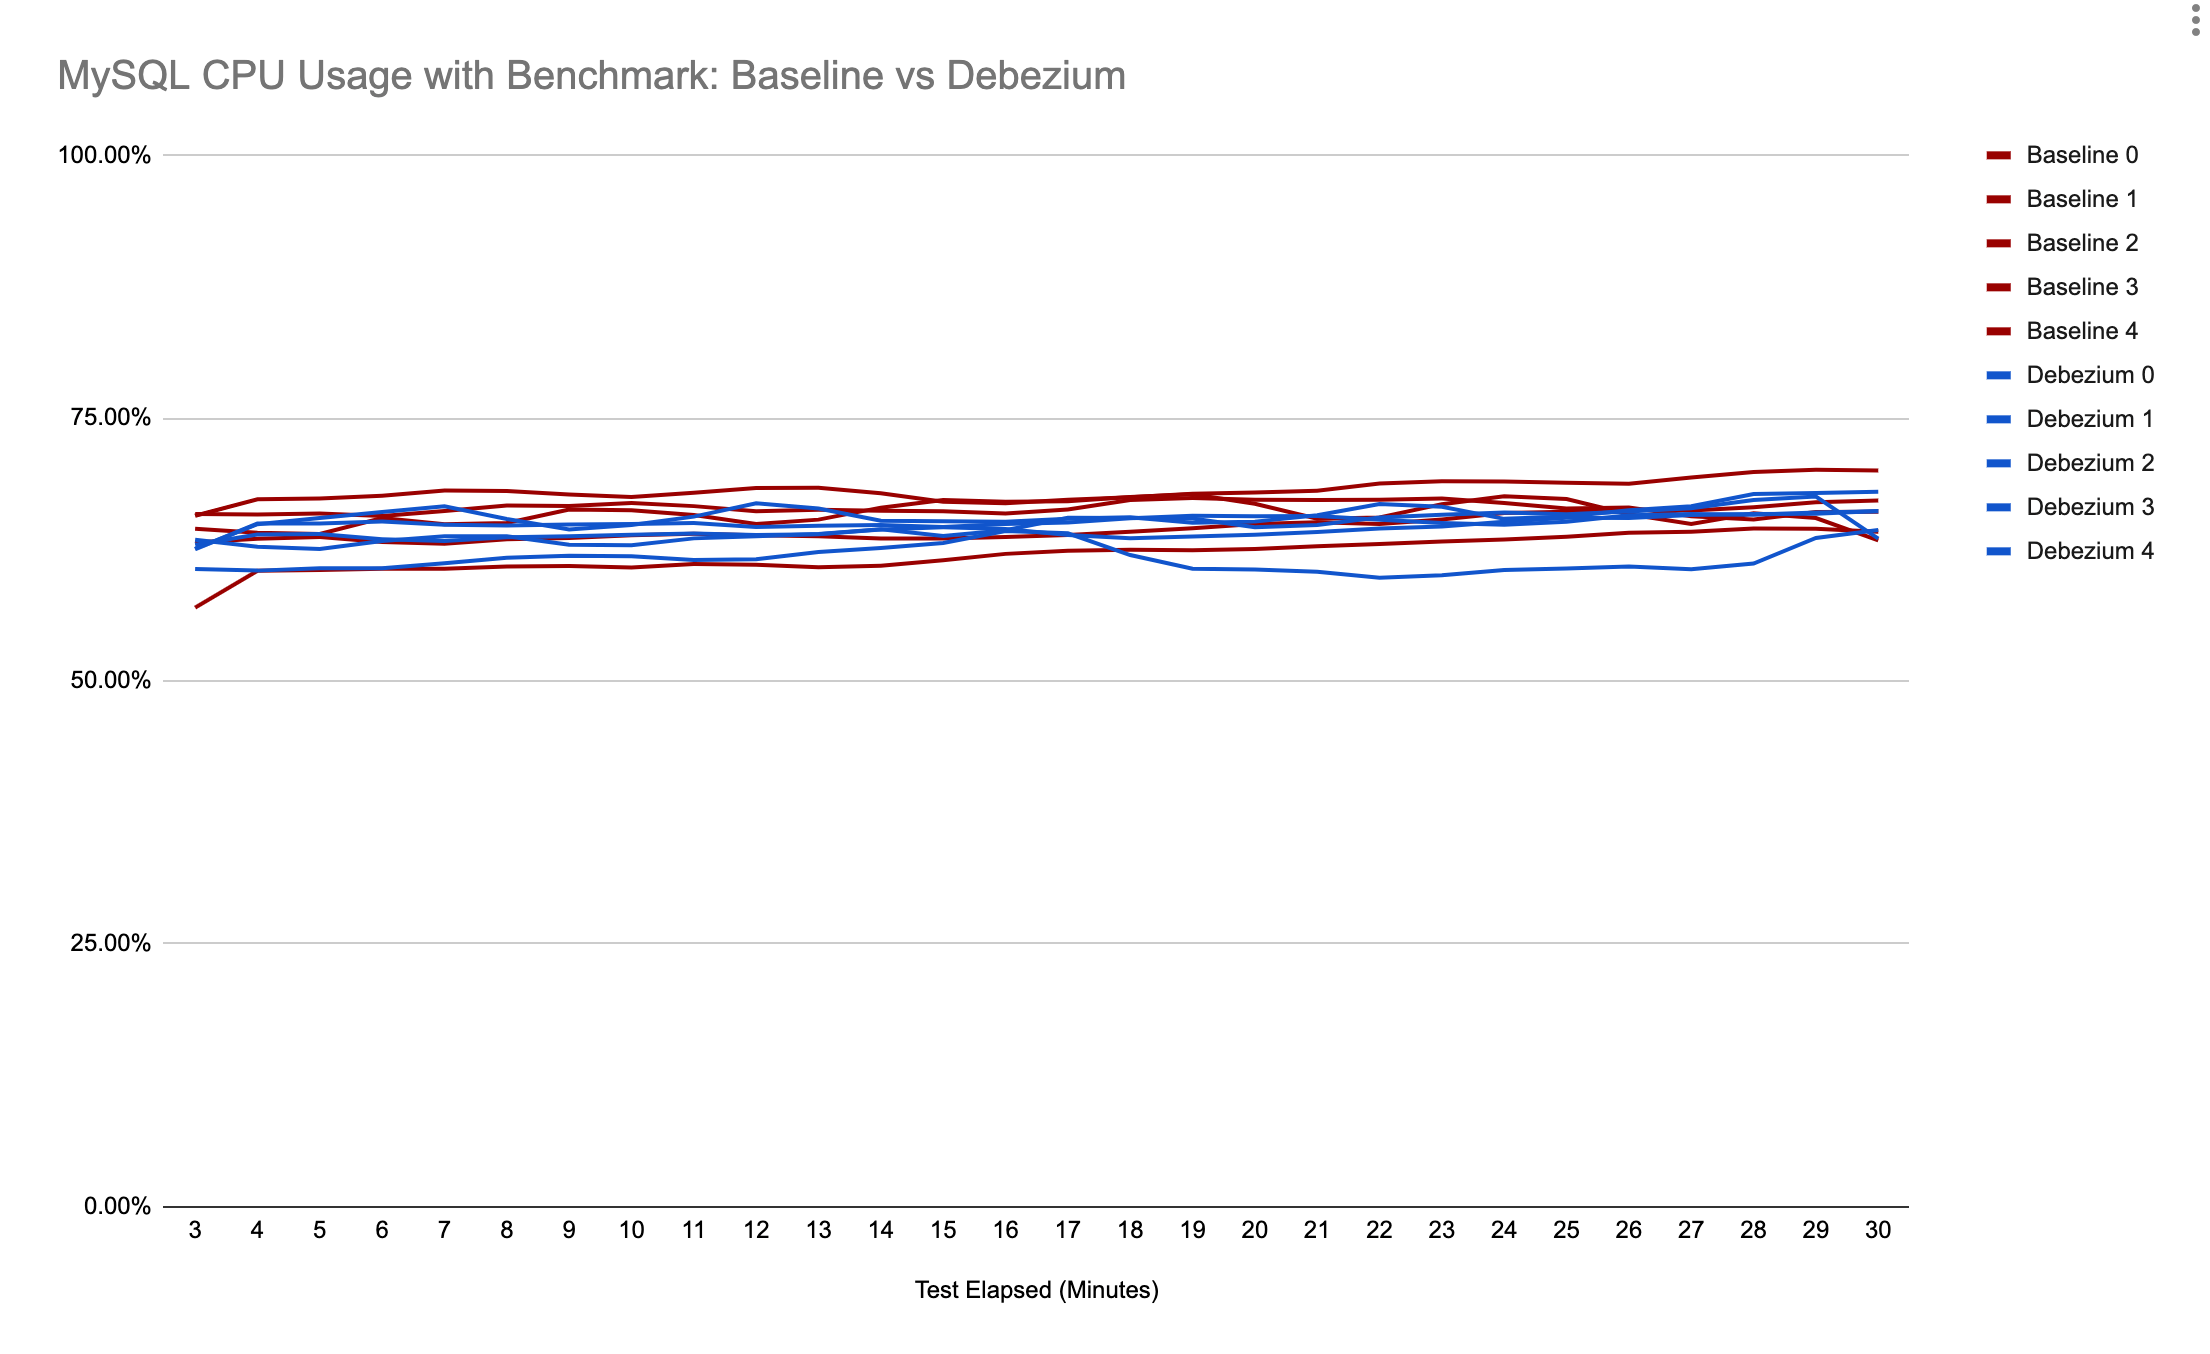
This chart has been configured to ‘overlay’ the runs to show the CPU utilisation at the same minute into the benchmark execution.
Consumption
If you are struggling to process the events produced by Debezium then try the Arc plugin that allows you to safely consume and reproduce the state of your source table at a point in time.
Updates
Updated 2021-03-04 to clarify binlog/write-ahead-log vs transaction log language and fix some language.